Content |
||||||||||||
|
Overview |
|
|
Description |
The Log File Viewer provides a convenient method of downloading LabVantage log files, as well as a set of tools to parse and analyze the logs.
If you are unfamiliar with LabVantage logging, see System Configuration → Logging and Stats Options.
Examples in this document assume LabVantage log files are generated in the default location APPLICATION_HOME\logs.
Snapshots |
The Log File Viewer takes a snapshot of the log, as live log files are continually being appended. Snapshots are saved in a folder defined by the "Snapshots Folder" property in System Configuration → Logging and Stats Options. Before using the Log File Viewer, you must create this folder and specify it using the "Snapshots Folder" property. LabVantage recommends creating this folder in APPLICATION_HOME\snapshots. This property is saved in the labvantageconfig.props file and is thus common to all LabVantage databases connected to the running application server instance.

|
In a non-clustered environment, the snapshot folder is typically on the machine hosting the application server.
In a clustered environment, all nodes should share the same physical snapshot folder to allow viewing and downloading snapshots from all nodes in the cluster on a single client. In a cluster, this property should therefore point to a single shared network folder.
Log File Viewer Page |
|
|
Generating Snapshots |
| NOTE: | Generating Snapshots does not require the User to belong
to any specific Role. However, all other Log File Viewer operations (such
as Download and the operations described in Analyzing
Snapshots) require either the "Administrator" Role or the
"IssueSubmitter" Role.
This behavior applies to LabVantage 8.4.1 and higher LabVantage 8.4.x Maintenance Releases. |
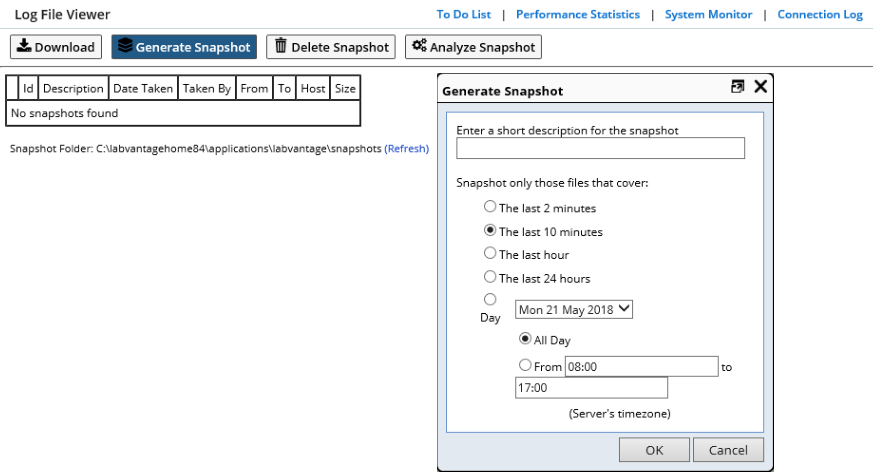
The Log File Viewer page (SystemAdmin → Monitoring → Log File Viewer) shows snapshots that have already been generated. Clicking "Generate Snapshot" opens the corresponding dialog:
|
The "Generate Snapshot" dialog lets you enter a description and choose a time range for the snapshot. Several shortcuts are provided to capture recent activity. Alternatively, a specific day (and optional time range) can be chosen from the list of days covered by the current log files.
Note that the volume of log file data can grow to be extremely large. The maximum time range to get snapshotted is therefore restricted to 24 hours. If a wide date range is required, multiple snapshots should be generated.
|
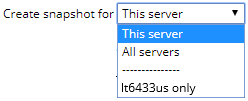
When running in a cluster, an additional "Create snapshot for"
option is available to choose servers to snapshot:
|
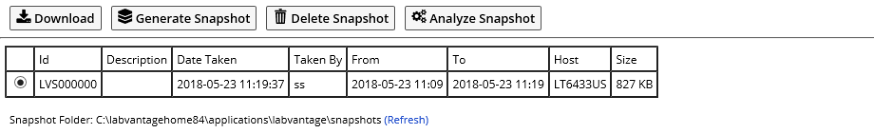
After taking the snapshot, each row in the table represents a snapshot zip file in the snapshot folder. Each snapshot file includes a "manifest file" to store information gathered when the snapshot was taken.
|
Some of this information is shown in the following columns:
| Column | Description |
| Id | Identifier representing the snapshot event. This is an automatically-generated key. If multiple servers are snapshotted together, all will share the same Id, but the "Server" column will differ. |
| Description | User-entered description of the snapshot when it was taken. |
| Date Taken
Taken By |
Date the snapshot was taken and by whom. |
| From
To |
Time range that was requested when snapshotting. Note that because the snapshot records only entire log files, the total range actually snapshotted might be larger than requested. |
| Server | Hostname of the server that was snapshotted. |
| Size | Size of the snapshot zip file. |
|
Depending on the date range and available system resources, the snapshotting process may take several minutes or longer. A progress meter is provided, which updates once per second and includes a "Cancel" button to cancel the snapshotting process. This is useful if processing is taking too long and needs to be restarted with a narrowed time range. |
Once the snapshotting process has completed, the list is refreshed and the new snapshot file is displayed in the last row.
|
Note that when generating snapshots on other nodes in a cluster, the list will not automatically refresh. A "Refresh" link is therefore provided, which can be clicked to retrieve the latest list of snapshots. |
Other Operations |
After a snapshot has been created, it can be downloaded by selecting the snapshot and clicking the "Download" button.
A snapshot can also be deleted by clicking the "Delete" button, then clicking "Yes" on the confirmation dialog.
Note that when a snapshot is being analyzed (as described in Analyzing Snapshots), the zip file is exploded into a working folder. Deleting the snapshot deletes both the zip file and the corresponding working folder (if one exists).
Snapshot zip files can be added into the snapshot folder at any time and will be visible after the next page refresh. This is useful if you receive a snapshot file from someone and want to analyze it. Note that the zip file itself can be renamed if it clashes with an existing file.
Analyzing Snapshots |
|
|
Overview |
Clicking the "Analyze Snapshot" button launches a process that indexes the contents of the log files. Because this indexing process can require some time, another progress meter is presented with an option to cancel if required.
Note that the indexing process is important, as it is used to populate the dropdown columns on the Search page (as described in Searching for Requests) and to make the searching process itself significantly faster.
After the index process is complete, the Snapshot Analysis page opens.
The page header shows a summary of the snapshot being analyzed. A "Back to Snapshots" button returns to the snapshot list.
The "Request Search Criteria" section can define search criteria to locate "requests" of interest (as described in Searching for Requests).
"Additional Analysis Options" provides additional utilities that can be performed on the snapshot.
Searching for Requests |
The indexing process runs through the snapshot once and identifies the location each "request". Note that a "request" can be:
| • | A browser request (such as Web page, file, or Ajax). |
| • | An Action (called from either a browser request or directly from internal automation). |
| • | A system startup. |
In addition to identifying the position of each request in the log files, the indexing process records additional information about each request (such as its thread number, the userid and connectionid for the request, and how long it required to process). Searching through the log files using these indexed values is therefore very fast.
The following table provides more information regarding the available search options.
| Criteria | Indexed | Description | ||||||||||||||||||||||||||||||||||||||||||
| User | Yes | User (SysUserId) making the request. Searching on only this value shows all activity for a single User. | ||||||||||||||||||||||||||||||||||||||||||
| Connection | Yes | Connection (ConnectionId) making the request. Searching on only this value shows all activity for a single User's session. | ||||||||||||||||||||||||||||||||||||||||||
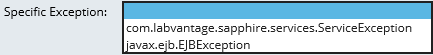
| Request Type and Value |
Yes | The following request types may appear in
a snapshot:
|
||||||||||||||||||||||||||||||||||||||||||
| Text in request body | No | The three "text" search fields
allow you to search for requests that contain a specific string of text.
Searching can be case-sensitive or case-insensitive. The three text fields
are ANDed together, meaning that a request must contain all provided text
values in order to match.
Note that the index operation described earlier does NOT include indexing the text body of the request. Therefore, when searching by text, every candidate request must be processed line-by-line, which can take some time. To speed the search, provide an additional Request filter such as a request type or a SysUserId. This will reduce the number of requests that need to be examined. |
||||||||||||||||||||||||||||||||||||||||||
| Contains Exception | Yes | As well as identifying requests in the log
files, the indexing process also looks for exceptions.
Note that because some requests (especially Action requests) can be nested within each other, if a nested request is flagged as containing an exception, its parent request(s) will be flagged as containing the exception as well. Note that the indexing engine records ALL exceptions, including those that might occur outside of a request (for example, exceptions thrown by the automation engine). These exceptions (together with the request exceptions) can be viewed using the "Show All Stack Traces" button. |
||||||||||||||||||||||||||||||||||||||||||
| Request Duration | Yes | The indexing engine measures and records the duration for each request. You can therefore choose to filter the list of requests by entering a minimum request duration (in milliseconds). | ||||||||||||||||||||||||||||||||||||||||||
| With Step Duration | No | The log file includes a fully-qualified date and time for every log record to millisecond resolution. The search engine can use this information to include only requests that contain two consecutive log records greater than a number of millseconds apart. This can be useful when trying to search for requests that contain slow running queries. | ||||||||||||||||||||||||||||||||||||||||||
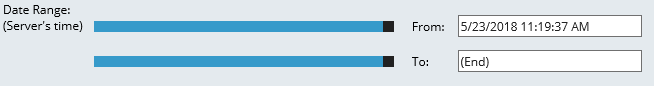
| Date Range | Yes |
As previously noted, the snapshotting process records only entire files, so often the snapshots cover a wider time range that was originally requested. For that reason, when the search window is first opened, the Data Range sliders will default their positions to match the original criteria when the snapshot was first generated. |
||||||||||||||||||||||||||||||||||||||||||
| Thread Number | Yes | Each request is executed by server thread.
If you know the thread number in which you are interested, you can search
on that thread. |
||||||||||||||||||||||||||||||||||||||||||
| Max Hits to Show | N/A | This field is not technically a search field. It limits the maximum number of hits that will be displayed once the search process is complete. |
Results View |
Once the search process has completed, the list of matching requests is shown on the next page. The example below is a list of all "page" requests that took longer than 1s (1000ms).
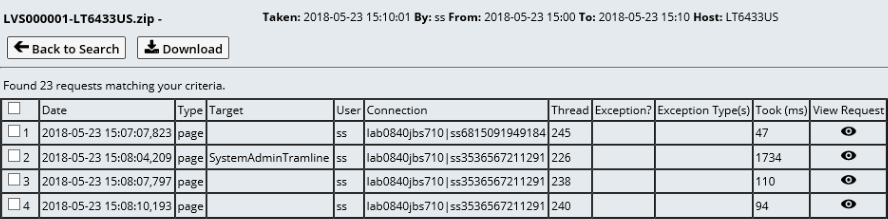 |
The "Back to Search" button returns you to the prior page where you can refine your search criteria.
The "Download" button downloads a zipped text file that contains the selected requests. You can use the checkbox on the header row to select ALL requests for download if needed.
The "View Request" icon and the end of each row can be clicked to view the requests from the search results in the preview page as shown below.
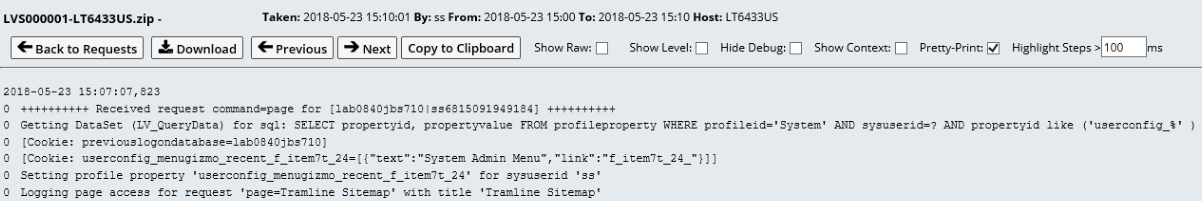 |
The "Previous" and "Next" buttons step through the search results individually without having to step back to the search results page. "Download" downloads the current request as a text file.
The "Copy to Clipboard" button places a formatted copy of the request into the clipboard. Because the clipboard contains a copy of the HTML table, it can be pasted into Excel (which preserves the column formatting). It can also be pasted directly into a text editor.
The preview page includes several formatting options:
| Function | Description | Example |
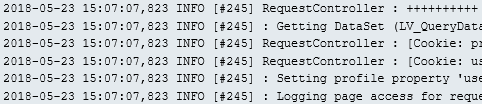
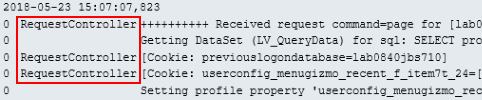
| Show Raw | The rows from the log file are presented exactly as they appear in the original log files without any additional formatting applied. |
|
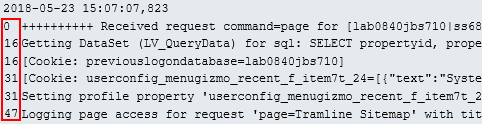
| If Show Raw is disabled, the date and time of the first line in the log file is shown first, followed by an offset (in milliseconds) from the start of the request. This is done to preserve space. |
|
|
| Show Level | Each log file row contains a "Level", which includes DEBUG, INFO, and so on. These values can be shown or hidden to preserve space. |
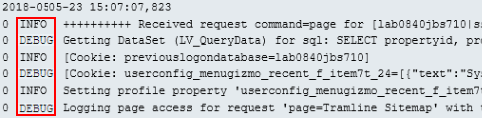
|
| Hide Debug | DEBUG-level rows can often get verbose and make the log files harder to read. For this reason, an option is provided to specifically hide the DEBUG-level rows. |
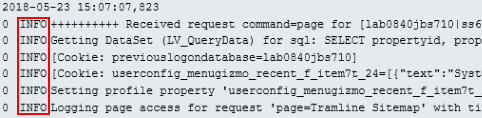
|
| Show Context | When the application is writing to the log file, it will attempt to write out a "Context" value, which essentially maps onto the Java class that generated the log entry. This context value can be shown or hidden to preserve space. |
|
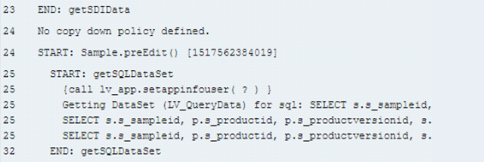
| Pretty-Print | The Pretty-Print option will attempt to add formatting to the log rows to improve readability. It does this by indenting between START and END points and inserting vertical white space between indented blocks. |
|
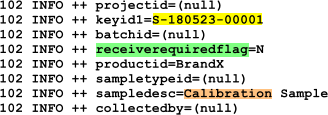
| Highlight Steps | Incremental milliseconds between each step can be highlighted in red if they exceed a certain threshold. |
|
Additional Analysis Options |
Strip Threads
The "Strip Theads" feature breaks the entire snapshot into a set
of text files, each containing the log entries for a specific thread. The
text files are zipped into a single file and downloaded to the browser. A
limited amount of formatting is applied to add some vertical white space between
subsequent requests.
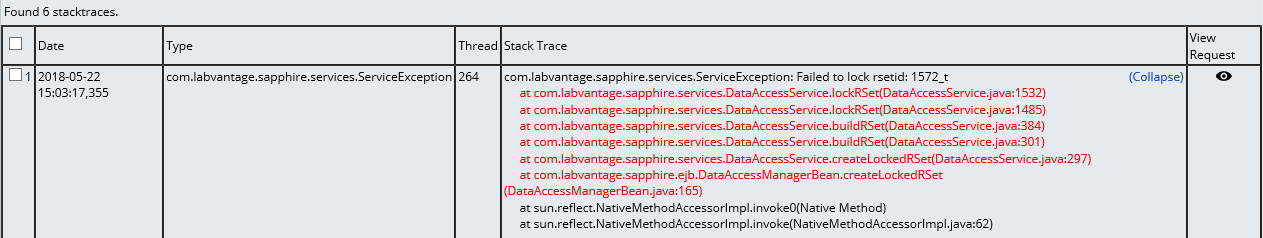
Show All Stack Traces
As previously described, the indexing process will identify and record exceptions whether or not they occur within a request. The "Show All Stack Traces" button provides access to these exceptions.
If the exception is contained within a request, a "View Request"
icon is shown alongside the exception. Clicking this icon opens the request
preview page.
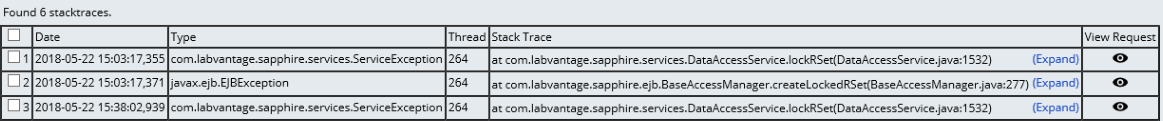 |
As well as showing the exception type, the Stack Trace column shows the Java Class and line number where the exception was thrown. The "(Expand)" link can be clicked to show the entire stack trace (below). Note that to preserve space and enhance readability, only the first two consecutive non-LabVantage classes are shown.
 |