Introduction |
|
|
Within LabVantage you can perform Stability Analytics using NWA Quality Analyst. NWA Quality Analyst is a Windows-based application that provides a comprehensive, integrated set of Statistical Quality Control (SQC), charting and analysis functions.
You can perform several types of statistical analyses on your data such as One-way ANCOVA, and Regression Analysis.
LabVantage supplies several pre-defined Analysis that can be run based on data collected in one or more Studies. These Analysis are generated from the Active Studies List Page where you can select multiple Studies for Analysis. See Running NWA Analyses for details.
Since NWA is a licensed module, all users that need to access the NWA functionality need to be given access to the NWA Module.
See NWA Installation and Deployment for detailed information about Installing and Deploying NWA Quality Analyst for LabVantage.
Stability Analytics |
|
|
The following Analyses are supplied OOB with LabVantage.
| Name of the Analysis | Description |
| ANCOVA_ILP (Internal Alert Limits Pool Data) | Produces a text report that displays the internal alert limit determined by pooling the slope and intercepts of all batches. Uses a proposed shelf life. |
| ANCOVA_ILS (Internal Alert Limits Pool Slope) | Produces a text report that displays the internal alert limit determined by pooling only the slope of all batches. Uses a proposed shelf life. |
| ANCOVA_ILW (Internal Alert Limits Worst Case) | Produces a text report that displays the internal alert limit based on the worst case batch. Uses a proposed shelf life. |
| ANCOVA_POOL (Pooling All Data) | Produces a chart of stability data with a regression equation and shelf life prediction determined by pooling the data of all batches. |
| ANCOVA_SLOPE (Pool Slopes) | Produces a chart of stability data with a regression equation and shelf life prediction determined by pooling only the slopes of all batches. |
| ANCOVA_TABLE (Table) | Produces an ANCOVA text report that displays the statistics associated with an analysis of covariance. |
| ANCOVA_WORST (Worst Case) | Produces a chart of stability data with a regression equation and shelf life prediction based on the worst case batch. |
| ANCOVA_OOT (Out of Trend) | Produces an out of trend chart for the last point of a batch. |
| STAB_LINEARITY (Linear Regression) | Least-squares fit of the data to a linear equation of the form: y = B0 + B1x |
| STAB_POLY (Polynomial Regression) | Least-squares fit of the data to a polynomial equation of the form: y = B0 + B1x + B2x |
| STAB_SHELFLIFE (Shelf-life Prediction) | Stability Regression. Similar to Linear Regression Linearity, except it also include shelf-life prediction results. |
| STAB_OUTOFTRENDIR (Residual Trend Check) | Charts the residuals from a linear regression analysis of the data. |
Running NWA Analyses |
|
|
NWA Analyses can be executed from the Active Studies list page or the Historical Studies List page.
| LIMS | → | Studies | → | Active Studies Historical Studies |
Note that the List pages provide Queries to allow filtering of studies by Storage Condition, Protocol, Product, Container and Batch id.
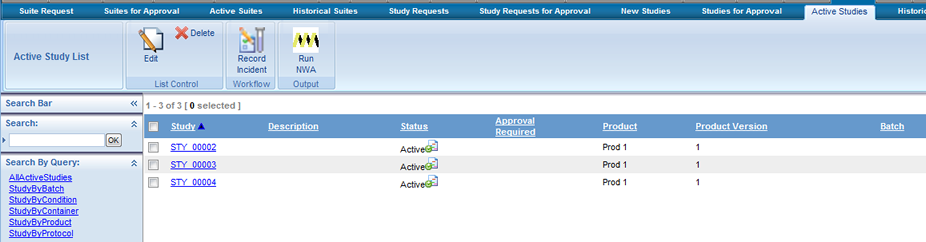
Select one or more Studies to analyze and click on the "Run NWA" button.
The list of preconfigured NWA Analyses with the category "NWA" are displayed in the Report Lookup window:
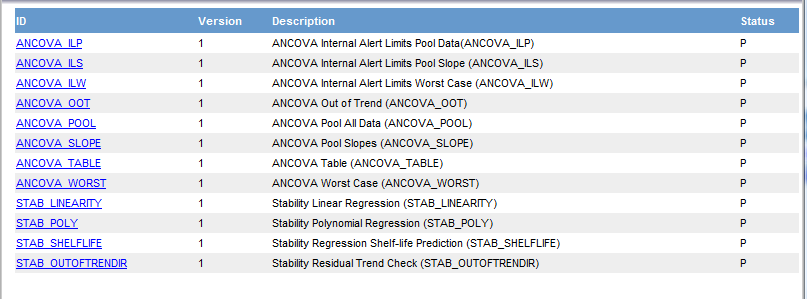
Choose the NWA Analyses you would like to run. Click on the Analyses to open the "Report Inputs Page" for that Analysis. In this example the ANCOVA Pool Slopes Analysis was selected, the following Input Page is displayed.
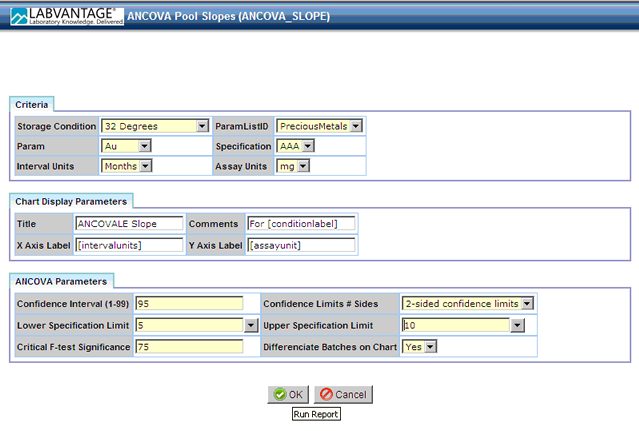
Specify the required values to run the analysis.
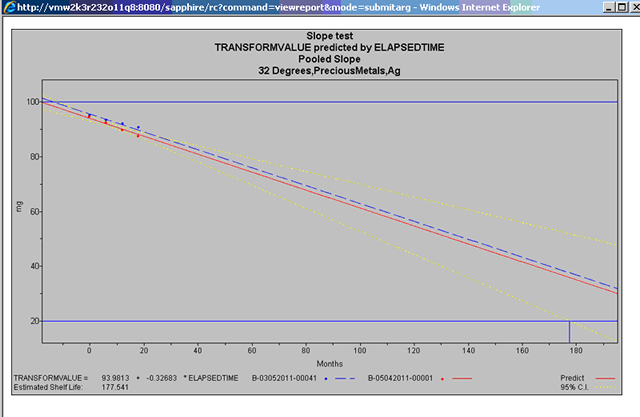
Click "OK", the NWA Analyses is performed by LabVantage, all the values entered in the Report Inputs Page are sent to NWA and in this example the following Analysis is generated.
Analyses Events |
|
|
When defining an NWA Analyses you have the option to Generate an Analysis Event each time an Analysis is run for a particular Study (see NWA Analysis for details about defining or editing an Analysis).
You can view the list of previous Analyses run for a Study by clicking the NWA icon on the "Active Study List" page.
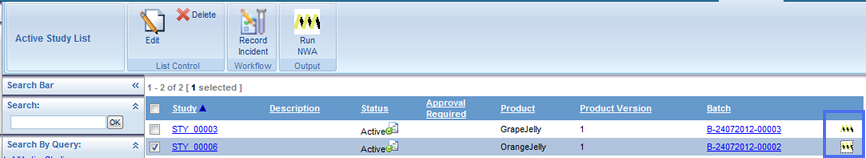
Clicking the NWA Icon displays a list of Events for the Study in reverse chronological order.

Viewing the Previous Analysis
Click the Analysis Icon![]() to view the results of the previous Analysis.
to view the results of the previous Analysis.
Note: The description in each of the Analysis Events corresponds to the "Event Description Rule" in the NWA Analysis Definition. See NWA Analysis for more information.
Viewing Attachments
The Attachments Icon ![]() allows you to view Attachments created for the event. Clicking the Attachment Icon displays a list of the Attached file types.
allows you to view Attachments created for the event. Clicking the Attachment Icon displays a list of the Attached file types.
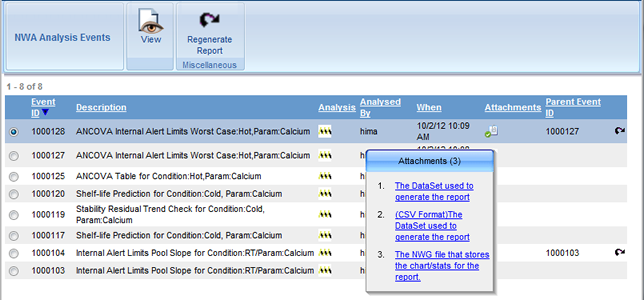
Use the Attachment Icon ![]() to view the DataSets and NWG files used to generate the report.
to view the DataSets and NWG files used to generate the report.
Attachments 1 and 2 contain the DataSet used to generate the report. Option 1 gives you the opportunity to open the .DAT file. Option 2 is a CSV file that you can view in Excel.
Attachment 3 is the NWG file.
Note:Use the NWA Graphics Viewer (when installed) to view .NWG files.
Viewing the Event in Detail
Selecting an Event and clicking the "View" button on the NWA Analyses Events page displays the View Report Event window. Here you can view details about the criteria used to generate the Analysis (Report).
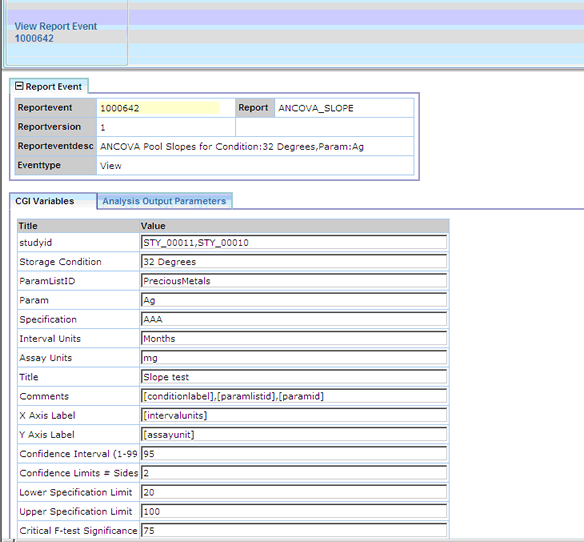
The CGI Variables tab displays the list of input parameters that were used to run the analysis.
The Analysis Output Parameters Tab displays the values of the various metrics that are extracted from the .NWG file downloaded from the QA server.
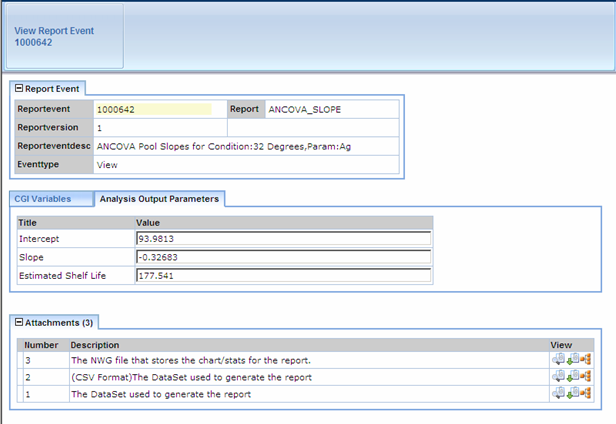
In the Attachments tab you can view or download the attached files or view a revision history for the file.
Regenerate the Report
You have the option to Re-analyze current data using criteria established for a previous Analysis (Report). Select the Event you would like to Re-analyze and click "Regenerate Report". A new Analysis (Report) is generated.
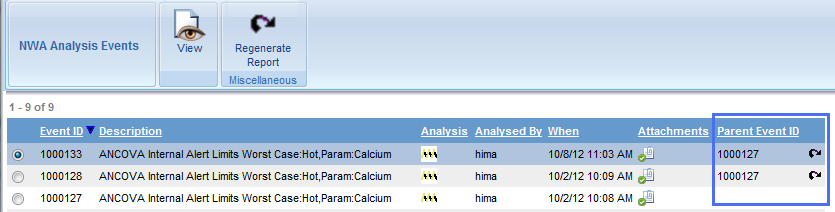
A new Event is added to the NWA Analysis Events list. In the Parent Event ID field the original or Parent Event is listed with the Regenerate Icon indicating that this report was regenerated from a previous report.