Overview |
|
|
Trend Charts display query-based plots of Sample data on the "Trend" tab of Data Entry Pages. The chart retrieves Sample results based on the selected Sample's Product, then orders data points for a selected time period.
In order for data to be shown in the Trend Chart:
| • | The Sample must be associated with a Product. Tests can be defined in the Product or the Sample. |
| • | The Sample creation date (CreateDt) is within the range of the defined "Time Period". |
| • | The Data Item must have an entered value, i.e., SDIDataItem.EnteredText must have a value. |
| • | Data have not been Cancelled. |
| • | Data can be Released or not. If not Released, the chart indicates this with an "Unreleased" notification next to the chart. |
To generate a Trend Chart:
| 1. | Select at least one Data Item. If you choose multiple Data Items, they must be from the same Sample. |
| 2. | Click the Trend tab. Tabs and Charts are configurable (see Configuring Data Trend Charts for more information). |
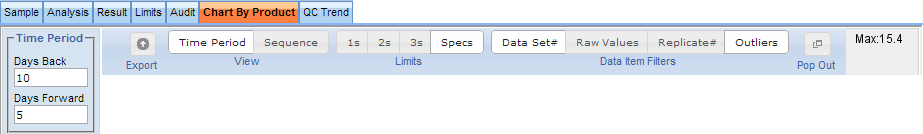
| 3. | Define the Time Period you want to view. The Reset button resets to the original search values. You can reset the chart anytime (such as to stop loading large amounts of data). Changed values are stored until the user logs off. |
| 4. | Hovering your cursor near the title opens a menu with additional options for displaying data. See Working with the Chart for details. |
| 5. | The selected Data Point is marked with a dotted marker line. |
| 6. | Click the node for specific information about the data point. |
Working with the Chart |
|
|
Open and close the Chart Toolbar by clicking the arrows that display between Time Period and the title (mouse over the title area to display the arrows).
| Field | Description |
| Export | Exports chart data to Excel. |
| View | Choose to view data by Time Period or Sequence.
Toggle between:
Time Period shows the create date in the X axis. Sequence shows the sequence number of the point (1, 2, 3) in the X axis. |
| Limits | Choose to include Limits in the chart.
Toggle between the following:
1s, 2s, and 3s. Limits based on the current data's Standard deviation are visible. The limits are calculated dynamically, select which Limits you want to be visible. The Mean value is visible with all selections. Specs, specification Limits are visible. |
| Data Item Filters | Choose to show Data Sets, Replicates and Param Types. |
| Pop Out | Moves the chart to a full page. |
When multiple data items are selected the following additional Toolbar options become available.

| Field | Description |
| Plot | Toggle between showing all series in one plot (1) or showing each series in its own plot (1+). |
| Y Axis | Toggle between mapping all series to the same Y axis (1) or mapping each series to its own Y axis (1+). |
Examples |
|
|
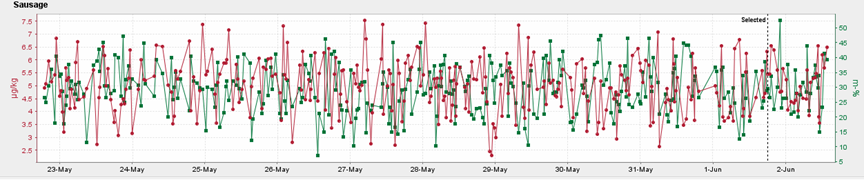
Selecting Plot 1 plots all datapoints on the same chart, all on the Y Axis (1):
Note: Limits cannot be displayed.
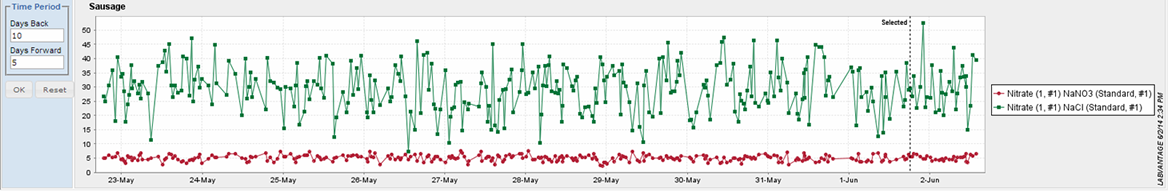
Selecting Plot 1+ puts each data item in its own Plot sharing the Y Axis (1).
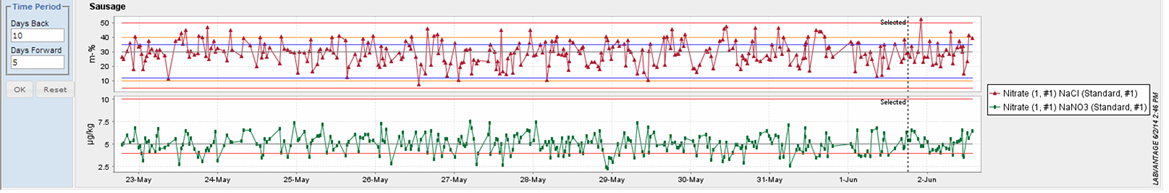
Plotting multiple Data Items references each to its own Y Axis (1+).
Viewing the Chart |
|
|
The Chart contains the following tools and features available when viewing:
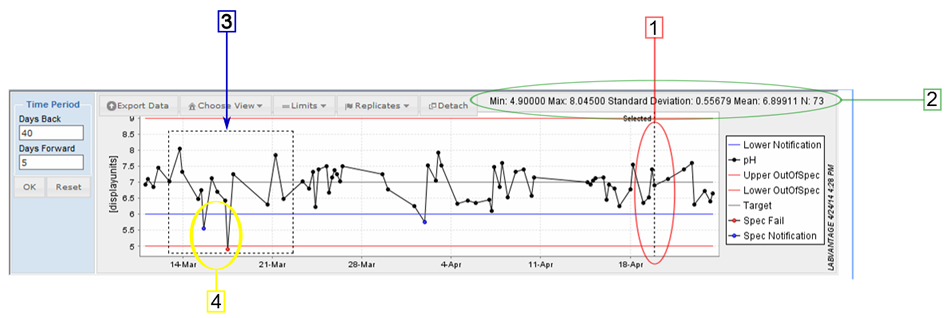
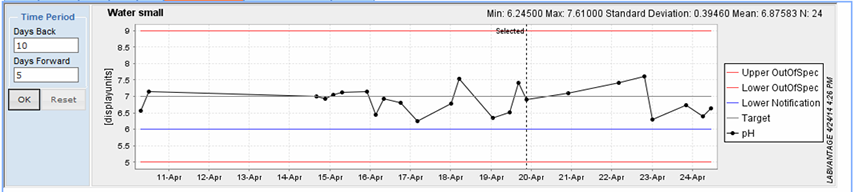
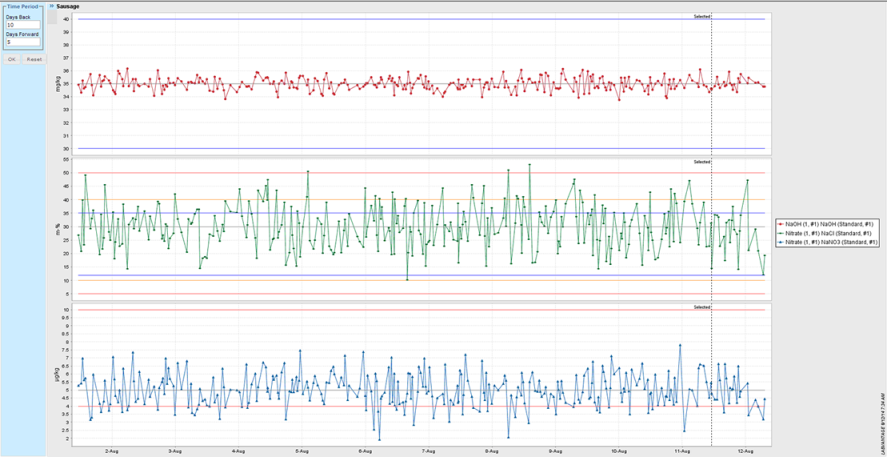
The chart displays lines indicating the Specification limits: Notification (blue), Warning (orange) and OutOfSpec (red). Data points falling outside the limits are shown in the corresponding color.
| Feature | Description |
| 1 | Selected sample is marked with a vertical dotted line labeled "Selected". |
| 2 | Chart calculates statistics from the plotted data. The following statistics are calculated:
N: Number of data points Statistic values are formatted using the display format of the selected Param List item. If Param List item does not have a display format defined then number of decimals defaults to four (4). |
| 3 | Data can be zoomed by holding down the mouse button and drawing a rectangle, pulling the mouse from top left corner toward bottom right corner. To return from a zoomed view, draw a rectangle starting from the bottom right corner. |
| 4 | The following special data points are highlighted using various colors and shapes:
Specification Failure (red node) |
Data Item Tool Tip and Operation Menu
Mousing over a Data Item displays information about the Data Item.
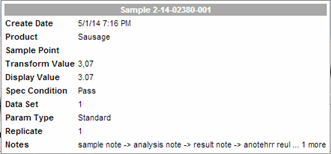
Clicking a Data Item displays the Operation Menu.
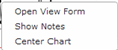
| Operation | Description |
| Open View Form | Opens the clicked Sample in View form. |
| Show Notes | Loads the Notes of the clicked Sample on the Notes panel. |
| Center Chart | Sets the clicked Sample as the new base sample for the Chart. |
Configuring Data Trend Charts
Data Entry Trend Charts are configurable using the the following Elements:
| Element | Description |
| dataprovider | Fetches data from the database and organizes it. |
| datachart | General configuration of the Chart. |
| argumentbar | Defines arguments provided via URL or by the User. |
| xyplot | Configuration of x/y Chart. |
| categoryplot | Configuration of the Category Chart. |
| pieplot | Configuration of the Pie Chart. |
| combineddomainxyplot | Configuration of a multi-plot x/y chart. Links multiple xyplot elements together. |
jFreeChart (v1.0.17) library is used to render the chart image. Configuration of the data chart reflects jFreeChart API (www.jfree.org/jfreechart/api/javadoc/). The user configuring the page must understand the basic concepts of jFreeChart library.
Additional Plot Options
Optionally configure any of the following:
| Plot Option | Example |
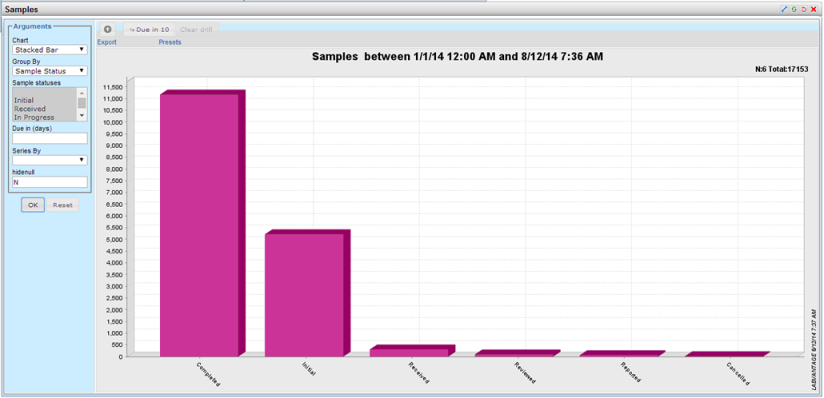
| Category Plot | Displays results by Category.
|
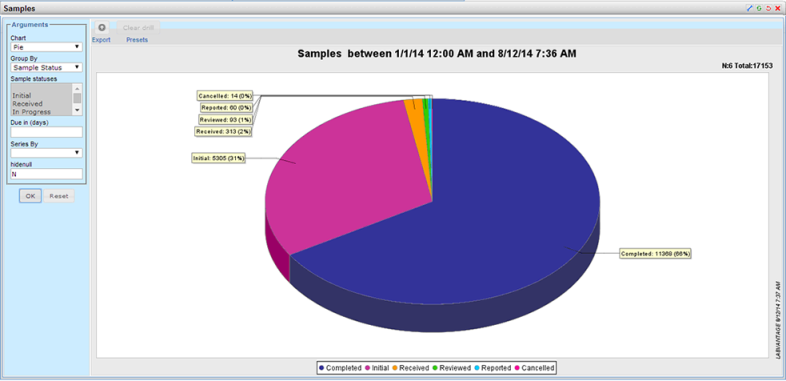
| Pie Chart | Displays results in a Pie Chart.
|
| Combined Domain XY Plot | Links multiple xyplot elements together.
|
Example Configuration Change
Following is an example of ways in which you might configure the default chart.
To Change the Query that Fetches the Samples
Open the dataprovider Element. Data is fetched with Data Item Data Provider. This Data Provider is useful when a Sample result trend is needed.
Change: Data Set Provider → Standard Data Set → Data Item DataSet → Query → Query ID.
The default query is SamplesRelatedByProduct. You can change it to another Sample query.
Note: You may need to change the query parameters as well.
Show New Query Argument in Argument bar
To show the new query argument in the Argument bar edit the argumentbar Element.
The arguments may be placed in different groups. The "Value" field contains the default value. It may also contain a variable from the URL enclosed in square brackets.
Note: Only arguments defined in the argument bar can be used as query parameters.
Add Additional Columns to the Data Set
By default, the data set contains following columns:
Primary SDC key column(s) (s_sampleid) and description column (sampledesc).
SDIDataItem keys (paramlistid, paramlistversionid, replicateid).
Result columns (enteredtext, enteredvalue, transformvalue, displayvalue).
To add new ones, in the dataprovider Element, edit Data Set Provider → Standard Data Set → Data Item DataSet → Add SDI Data Items → Columns. You may also select "Include All Primary Columns" to add all column values from the Primary dataset.
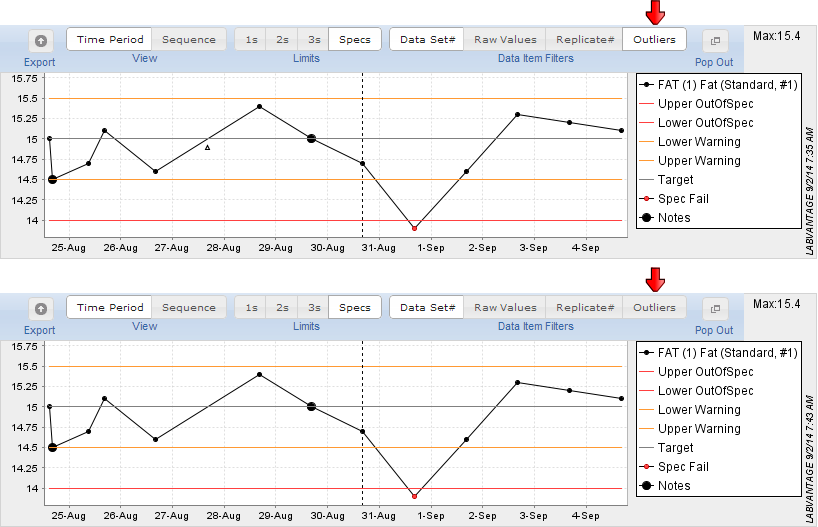
Viewing Outliers
Users can choose to show or hide results marked as outliers (below). Clicking "Outliers" toggles between showing outlier results as triangles appearing outside of the result series (this is default), or hiding outlier results from the result series. When hidden, outlier results are not event retrieved from the database.