SDMS Dashboards
| Top |
SDMS Dashboards |
|
|
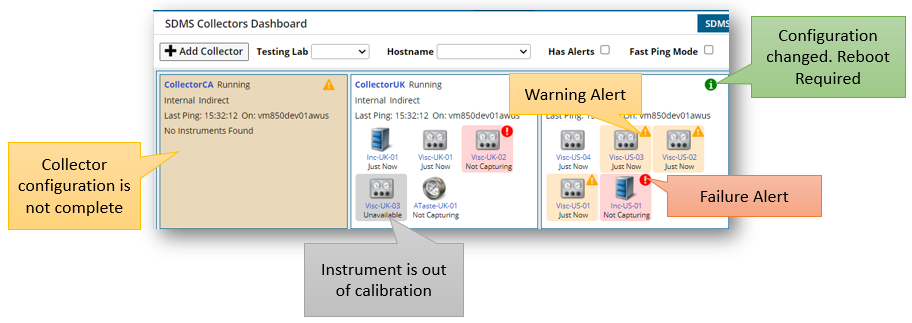
The purpose of the SDMS Collectors Dashboard is to give you some monitoring tools to keep track of Collectors, Instruments, Data Captures, and attachment handling for the SDMS module. By default, the dashboard shows all the collectors and all their instruments in a single view. You can choose to limit this to just those collectors which are managing instruments in your department or just those that require attention.
Each collector and instrument has an icon that shows if there are any Alerts against that item. The yellow warning triangle shows if there are Warning alerts. That changes to a red exclamation mark if there are any Error alerts. Some basic information about the state of the collector and the last instrument collection times are shown in the graphic too, with more information available by hovering over the graphic.
For convenience, there is a button that can be used to add a new Collector.
Accessing the Dashboards |
|
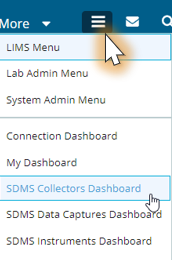
There are two primary means of accessing the SDMS Dashboards. One is through the menu picker. A second is through the Lab Admin menus. These options will be hidden to anyone who is not granted the SDMS module. Navigate to Lab Admin > SDMS > SDMS Dashboard. From each dashboard you fill find links that bring you to the next dashboard layer showing you details about the selected item. SDMS Collectors Dashboard gives you a top-level view of your collectors, their status, and the option to add another collector. SDMS Instruments Dashboard gives you a mid-level view of instruments that are being monitored by your collectors. SDMS Data Captures Dashboard gives you a bottom-level view of data captures across all instruments with filtering options. |
|
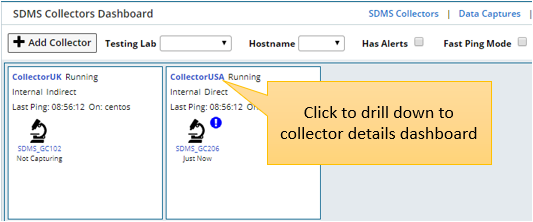
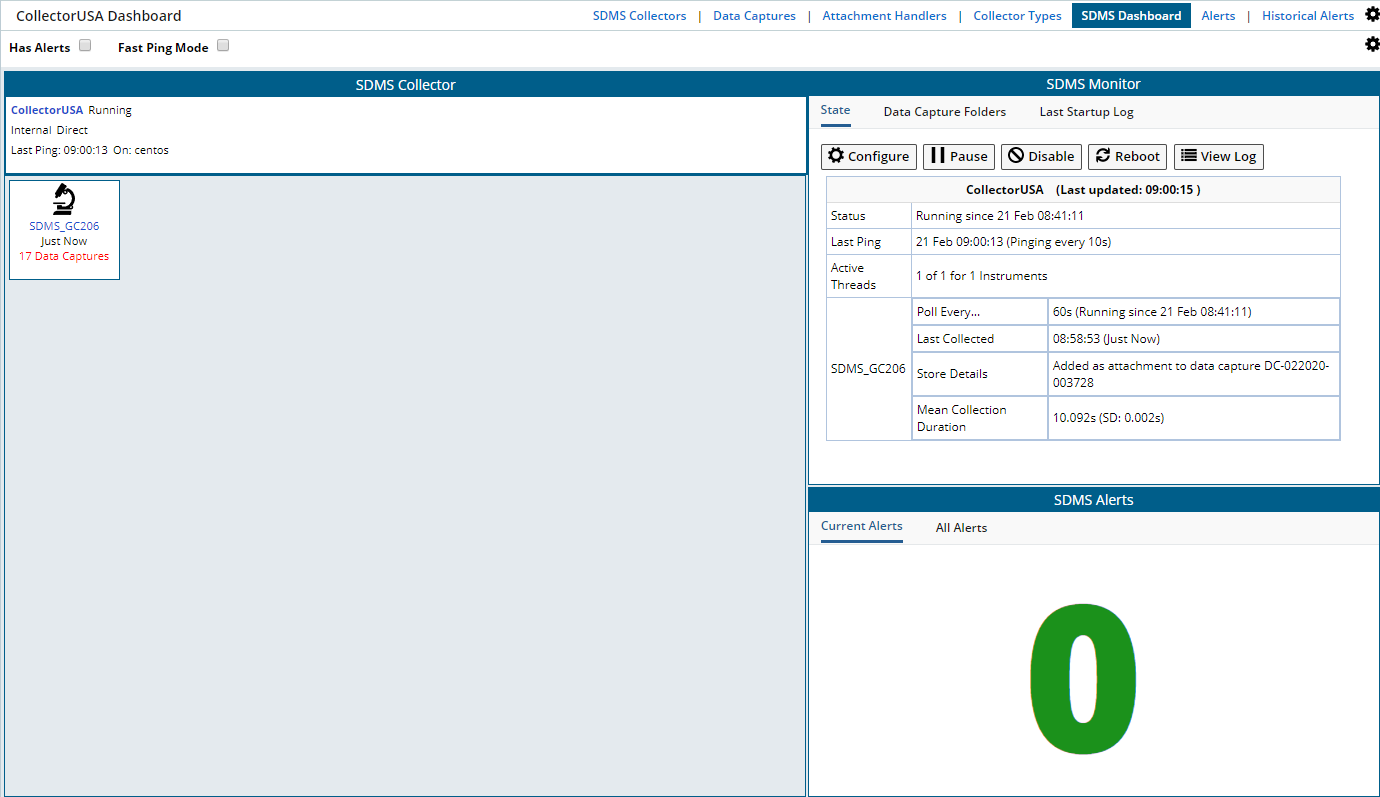
The Collectors Dashboard |
This top-level view shows all the collectors and their status. Refer to the Collectors help topic for more information about Collectors.
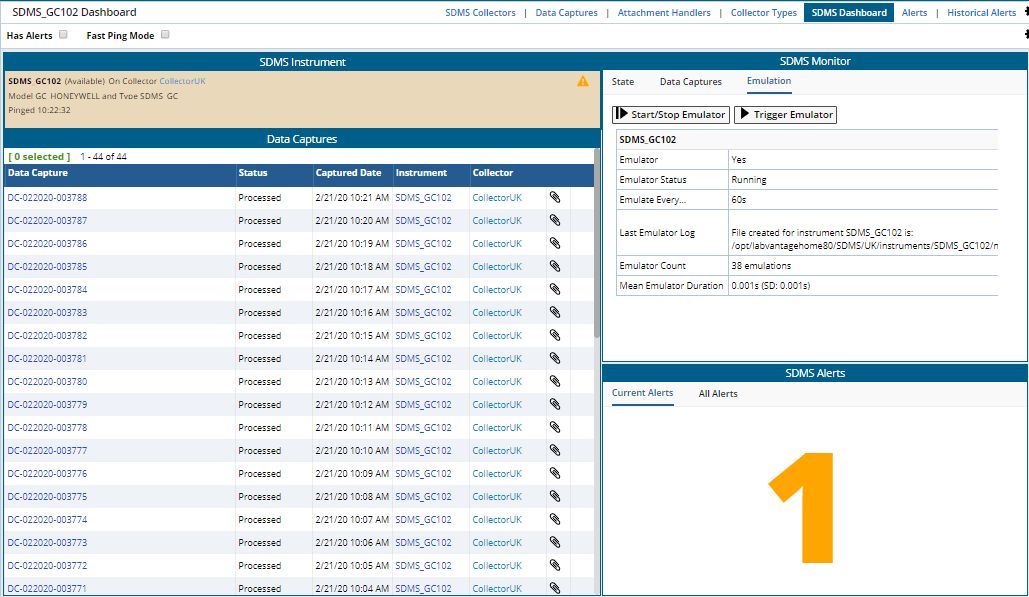
Collector Details dashboard will allow you to configure, pause, resume. disable. reboot. and view the log for a Collector using the buttons to the right. Hyperlinks on the left allow you to drill down to the Instrument details and the Data Captures. The SDMS Alerts gizmo displays current alerts for the Instrument.
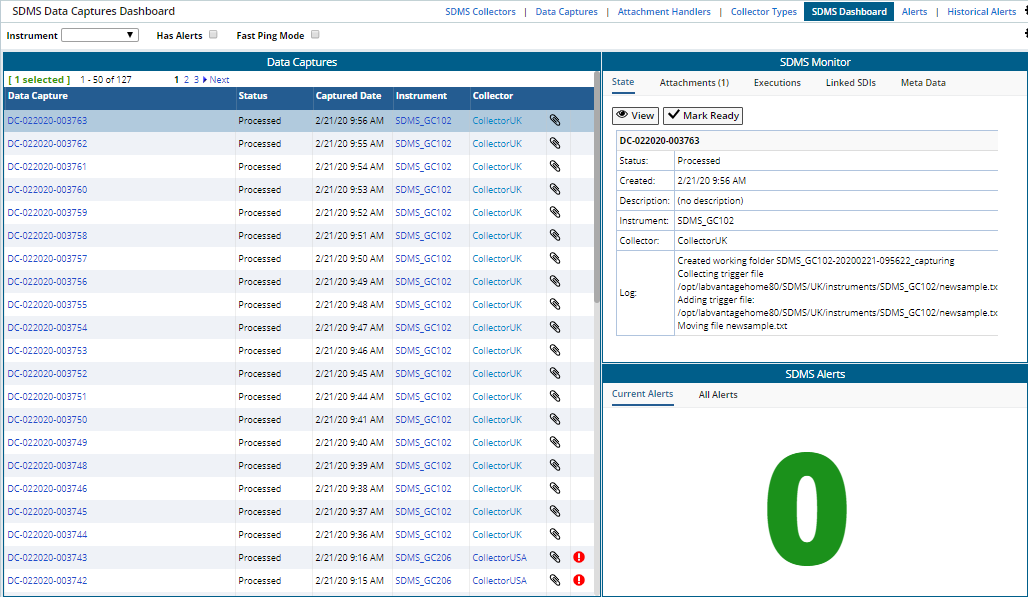
The Data Captures Dashboard |
Similar to the Collectors dashboard, the Data Captures Dashboard has links to individual data captures, attachments, handler executions and alerts. Refer to the Data Captures help topic for more details. This dashboard gizmo updates automatically when a new data capture is detected.
The SDMS Instruments Dashboard |
Finally, the SDMS Instruments Dashboard shows those instruments that have been associated to a Collector. From here, you can drill-down to an Instrument Details Dashboard for each instrument.

Showing the Instrument Details Dashboard