QC Calculations are automatic calculations performed on the various Samples of the QCBatch. These calculations automatically add additional dataitems per Parameter on the different Samples. These additional dataitems are often used for evaluation.
Calculations might include:
| • |
Calculations within a single QC Sample such as a RPD, Relative Percent Difference between the observed value and a nominal expected value. |
| • |
Calculation between successive linked QCSamples such as a Spike QC Sample, and the Sample that was spiked. |
| • |
A calculation that accesses the true value as defined in the Consumable Lot that is referenced from the QCSampleType. |
| • |
Calculations across the group of Unknown Samples such as a blank subtraction that takes a blank value and subtracts off from other Samples near the blank. |
The Calculations to be performed are defined in the Calculation Action field (on the QC Method in the QC Method Sample Type tab) for each QC Method Sample Type.
Behind each calculation is an action. This action is executed during Batch creation. The action is responsible for internally adding additional data items for each of the parameters that are present in the Test Methods/Parameter Lists as well as defining the Labvantage calculation syntax that will be executed during data entry.
These additional dataitems can be viewed in the standard data entry page shown here.
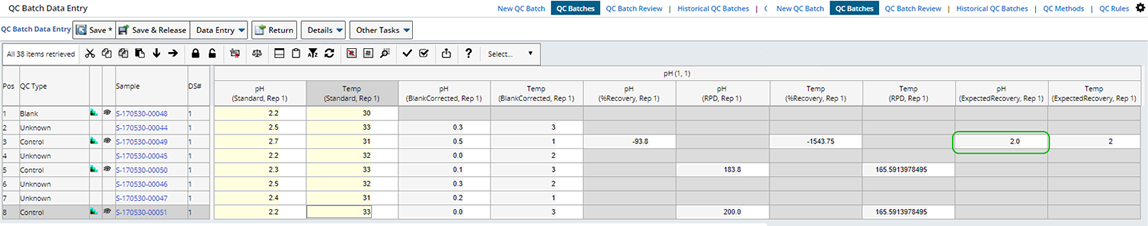
QC Calculations are performed real time, during data entry.
Along with the values entered during data entry (in the yellow colored fields) additional parameter values are used to perform the calculations. These values can be defined in the QC Method or by associated Consumable Lots.
The following sections describe each of the QC Calculations provided and any additional parameters needed.
Subtracts the Blank's data value from the value of other Samples. Some definitions
are in order:
| • |
A "Bracket Parent" is a Blank that has Unknown Samples and/or
QC Samples below it. |
| • |
A "Blank Bracket" defines a group of Unknown and/or QC Samples
beginning immediately below the Bracket Parent and ending at the next
Blank. |
Blank Correction is done on Samples in the Blank Bracket that have the same
Data Sets as the Bracket Parent.
In the example below:
| • |
Samples in positions 4 through 7 have the same Data Sets as position
3. Blank Correction subtracts position 3's value from Samples in positions
4 through 7. |
| • |
Samples in positions 9 and 10 have the same Data Sets as position 8.
Blank Correction subtracts position 8's value from Samples in positions
9 and 10. |
| |
Position
|
QC Sample Type
|
|
| |
1 |
Unknown |
|
| |
2 |
Control |
|
|
Blank Bracket ->
|
3 |
Blank |
<- Bracket Parent |
| 4 |
Duplicate |
|
| 5 |
Spike |
|
| 6 |
Unknown |
|
| |
7 |
Blank |
|
|
Blank Bracket ->
|
8 |
Blank |
<- Bracket Parent |
| 9 |
Unknown |
|
| 10 |
Duplicate |
|
| Formula |
Rc = Ro * Rb
where | • | Rc is the corrected concentration | | • | Ro is the uncorrected original concentration | | • | Rb is the concentration of the Blank |
|
| QC Sample Type
|
Unknown, Control, Duplicate, Spike |
| Data Item Generated |
Automatically adds a Data Item to each Sample (with an
Evaluate Param Type of "Blank Corrected") in the Blank Bracket. |
| Action Executed |
QCCalcBlankSubtract
|
Results of Blank Correction:
| 1. |
Mean/average is derived from all Replicates of a Data Item in a Bracket
Parent. |
| 2. |
Value of the derived mean is subtracted from the value of all matching
Data Items in the Samples within the Blank Bracket. |
| 3. |
Blank Corrected Data Item is added to all Samples within the Blank Bracket
for which Blank Correction is done. A difference value is also provided. |
Following Blank Correction, the Blank Corrected values are considered "base
values". Other QC Calculations (RPD, %Difference, %Recovery, Expected
Recovery) are done on the Blank Corrected values.
Here is an example of this evaluation during data entry:
| Sample 001
|
| Parameter
|
Type
|
Replicate
|
Entered Value
|
|
| Ca |
Standard |
1 |
30 |
<- Average/mean is
derived from all Replicates of a Data Item for a Blank.
|
| Ca |
Standard |
2 |
10 |
| Ca |
Standard |
3 |
24 |
| Z |
Standard |
1 |
9 |
|
| Z |
Standard |
2 |
10 |
|
| Z |
Standard |
3 |
11 |
|
| Ca |
Average |
1 |
21.333333 |
<-
Automatically derived average/mean value of the Data Item. |
| Z |
Average |
1 |
10 |
|
| Sample
002
|
| |
Parameter
|
Type
|
Replicate
|
Entered Value
|
|
| |
Ca |
Standard |
1 |
90 |
<- Values of Data
Item Replicates before Blank Correction.
|
| |
Ca |
Standard |
2 |
10 |
| |
Ca |
Standard |
3 |
20 |
| |
Z |
Standard |
1 |
4 |
|
| |
Z |
Standard |
2 |
3 |
|
| |
Z |
Standard |
3 |
6 |
|
| |
|
|
|
|
Blank Corrected values of Replicates: |
When
Blank Correction
is done for a Standard
Data Item, BlankCorrected
Data Item is added. |
Ca |
BlankCorrected |
1 |
69 |
| 90 - 21 |
= |
69 |
| 10 - 21 |
= |
-11 |
| 20 - 21 |
= |
-1 |
|
| Ca |
BlankCorrected |
2 |
-11 |
| Ca |
BlankCorrected |
3 |
-1 |
Additional Parameters
No additional Parameters are needed.
Expected Recovery is calculated from the concentration of the spiking solution,
and volumes of the Spike and Unknown Sample.
Additional information associated with the Spike QC Sample Type (spiking
and Sample volumes, actual concentrations of different parameters) are used
in this calculation.
Expected Recovery accesses the source Sample identified by the "LinkTo"
property of the QC Sample Type. This calculation executes when the Data Set
in the "LinkedTo" Sample is modified.
| Formula |
where
| • |
E is the Expected Recovery |
| • |
v is the volume of the Spike Sample |
| • |
V is the volume of the Unknown Sample |
| • |
C is the concentration of the parameter |
| • |
U is the concentration of the Unknown Sample |
| x |
= |
Measured Difference in Concentration |
| |
= |
SPV - U |
where
| • |
SPV is the value of the Spike Sample |
| • |
U is the concentration of the Unknown Sample |
%R = Percent Recovery
|
| QC
Sample Type
|
Spike |
| DataItem Generated |
Automatically adds a Data Item for each Parameter of
the Spike with an Evaluate Param Type of "ExpectedRecovery". |
| Action Executed |
QCCalcSpikePRecovery
|
Additional Parameters
Add the following Parameters when the QCCalcSpikePRecovery calculation is used.
| Parameter
|
Parameter Type
|
| In the QC Method, QC Sample Type tab, add a "Concentration" Parameter and value for each Parameter to be tested.
Or, You can use the Consumables module to obtain these parameter values by defining the following: In the Consumable Type, reference the associated Parameter List in the Consumable Params field. As Consumable Lots are added for this Consumable Type actual values must be defined for these Parameters in the Consumable Params detail. These values are then used by the QCCalcSpikePRecovery calculation. |
Concentration |
| In the QC Method, add the Sample Spike Volume Parameter. |
Standard |
| In the QC Method, QC Sample Type tab, add the Sample Volume Parameter. |
Standard |
See QC Methods → Define Additional Parameters for more information about defining these Parameters.
Alternative to Expected Recovery.
| Formula |
where
| • |
E is the Expected Recovery |
| • |
v is the volume of the Spike Sample |
| • |
V is the volume of the Unknown Sample |
| • |
C is the concentration of the parameter |
| x |
= |
Measured Difference in Concentration |
| |
=
|
|
where
| • |
SPV is the value of the Spike Sample |
| • |
U is the concentration of the Unknown Sample |
%R = Percent Recovery
|
| QC
Sample Type
|
Spike |
| DataItem Generated |
Automatically adds a Data Item for each Parameter of
the Spike with an Evaluate Param Type of "ExpectedRecovery". |
| Action Executed |
QCCalcSpikeIUPACMeth
|
Additional Parameters
Add the following Parameters for the QCCalcSpikeIUPACMeth calculation
| Parameter
|
Parameter Type
|
Value
|
| Define one Parameter for each of the Parameters to be tested. |
Concentration |
Define the actual values for each. |
| Spike Volume |
Standard |
| Sample Volume |
Standard |
See QC Methods
→ Define Additional Parameters for more information about defining
these Parameters.
|
|
|
|
Expected Concentration Method
|
|
|
|
|
|
Alternative to Expected Recovery.
| Formula |
where
| • |
E is the Expected Recovery |
| • |
v is the volume of the Spike Sample |
| • |
V is the volume of the Unknown Sample |
| • |
C is the concentration of the parameter |
| x |
= |
Measured Difference in Concentration |
| |
=
|
|
where
| • |
SPV is the value of the Spike Sample |
| • |
U is the concentration of the Unknown Sample |
%R = Percent Recovery
|
| QC
Sample Type
|
Spike |
| DataItem Generated |
Automatically adds a Data Item for each Parameter of
the Spike with an Evaluate Param Type of "ExpectedRecovery". |
| Action Executed |
QCCalcSpikeConcMeth
|
Additional Parameters
Add the following Parameters for the QCCalcSpikeConcMeth calculation
| Parameter
|
Parameter Type
|
Value
|
| Define one Parameter for each of the Parameters to be tested. |
Concentration |
Define the actual values for each. |
| Spike Volume |
Standard |
| Sample Volume |
Standard |
See QC Methods
→ Define Additional Parameters for more information about defining
these Parameters.
Calculates percent difference between the recorded and actual value of a Control
Sample.
| Formula |
where
| • |
P is the percent difference between the recorded and actual value. |
| • |
R is the actual result |
| • |
T is the expected result |
|
| QC
Sample Type
|
Control |
| DataItem Generated |
Automatically adds a Data Item for each Parameter of
the Control with an Evaluate Param Type of "%Difference". |
| Action Executed |
QCCalcCtrlDifference
|
Additional Parameters
Add the following Parameters for the QCCalcCtrlDifference calculation
| Parameter
|
Parameter Type
|
Value
|
| Define one Parameter for each of the Parameters to be tested. |
Concentration |
Define the actual values for each. |
See QC Methods
→ Define Additional Parameters for more information about defining
these Parameters.
Compares actual to Expected Recovery values of spiked and unspiked Samples.
| Formula |
where
| • |
%R is the percent recovery |
| • |
x is the mean of the actual recovery |
| • |
E is the Expected Recovery:
| • | For Spikes, this is calculated by the Expected Recovery
calculation. | | • | For Controls, this is the actual concentration from the
Parameter information of the QC Sample Type. |
|
|
| QC
Sample Type
|
Control, Spike |
| DataItem Generated |
Automatically adds a Data Item for each Parameter of
the Control or Spike with an Evaluate Param Type of "%Recovery". |
| Action Executed |
QCCalcCtrlPRecovery
and QCCalcSpikePRecovery |
Additional Parameters
Add the following Parameters for the QCCalcSpikePRecovery calculation
| Parameters
|
Parameter Type
|
Value
|
| Define one Parameter for each of the Parameters to be tested. |
Concentration |
Define the actual values for each. |
| Spike Volume (Spike Percent Recovery only) |
Standard |
| Sample Volume (Spike Percent Recovery only) |
Standard |
See QC Methods
→ Define Additional Parameters for more information about defining
these Parameters.
Checks the difference between two results. This calculation accesses the
"Link To" Sample defined by the QC Sample Type. The calculation
executes when the linked Data Set is modified.
| Formula |
|
RPD
|
=
|
|
(100) (2)
|
|
|R1
* R2| |
| R1 + R2 |
where
| • |
RPD is the relative percent difference |
| • |
R1 and R2 are the Sample and Duplicate results |
|
| QC
Sample Type
|
Duplicate |
| DataItem Generated |
Automatically adds a Data Item for each Parameter of
the Duplicate with an Evaluate Param Type of "RPD". |
| Action Executed |
QCCalcRPD
|
Additional Parameters
No additional Parameters are needed.
|