Overview |
|
|
"Classic" Data Entry pages were developed prior to LabVantage R5.1. They have been superseded by the current Data Entry pages, which use GWT technology to provide superior performance and enhanced usability. "Classic" Data Entry pages are maintained in this documentation solely for reference.
Data Entry Views and Modes |
|
|
Views |
|
Views are selectable at the upper right of Data Entry pages. |
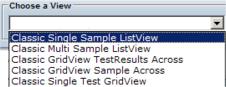
List Mode |
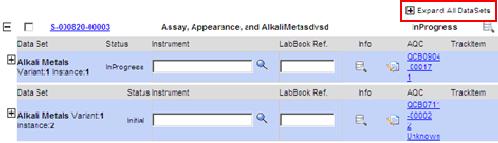
List mode displays Samples vertically, with Data Sets below each Sample. List mode can be displayed in two views:
| View | Description | |
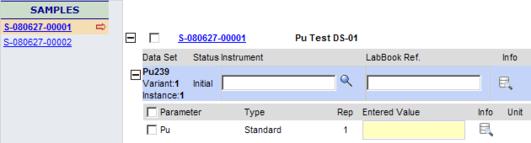
| Classic Single Sample List View |
Samples are listed in the left frame. Clicking a Sample
loads a Data Entry page in the right frame for that single Sample.
This view is available in Samples → Manage → Data Entry. |
|
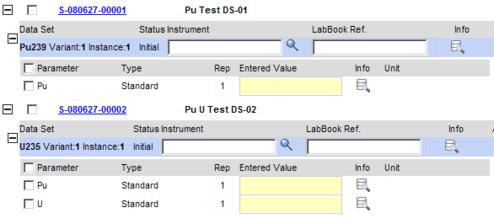
| Classic Multi Sample List View |
Each Sample is displayed vertically in a single frame
with its corresponding Data Sets and Data Items beneath each Sample.
This view is available in Samples → Manage → Data Entry, and all three Data Entry Query Options. |
Grid Mode |
Grid mode displays Samples or Test Results horizontally (similar to a spreadsheet). Grid mode can be displayed in three views:
| View | Description | |
| Classic Grid View Test Results Across |
Each Sample is listed in the left-most column with its
corresponding Data Sets and Data Items displayed horizontally.
This view is available in Samples → Manage → Data Entry, and all three Data Entry Query Options. |
|
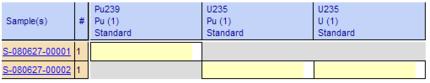
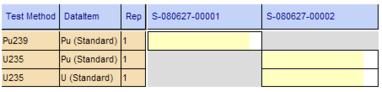
| Classic Grid View Sample Across |
Each Data Set and Data Item is listed in the left-most
column with its corresponding Samples displayed horizontally.
This view is available in Samples → Manage → Data Entry, and all three Data Entry Query Options. |
|
| Classic Single Test Grid View |
Same as Grid View Test Results Across, but you can also
filter the view to show only a single Data Set (rather than all).
This view is available in Samples → Manage → Data Entry. |
Data Entry Query Options |
|
|
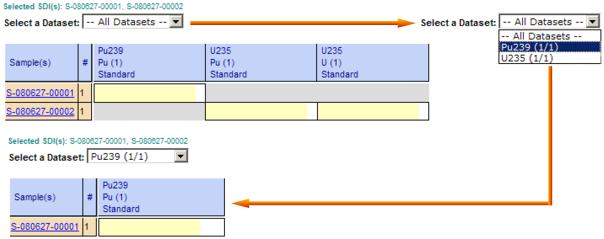
Data Entry By Sample Selection |
This opens a Sample List page. Use the Search Bar to query Samples for Data Entry. Select the Samples...
|
|
... then click "Data Entry".
|
|
Note the specialized Query "TestsByCurntUsrsDept", which only Tests that are pending and created by any User whose Department is the same as the current User's Department.
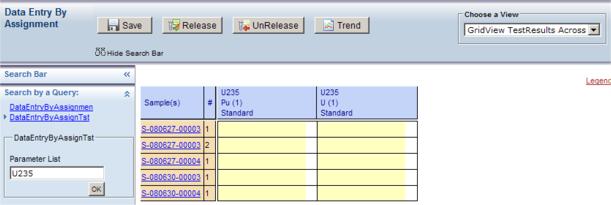
Data Entry By Assignment |
Use one of the Search Bar queries:
| Query | Description |
| DataEntryByAssignment | Opens Data Entry for all Samples associated with Parameter Lists assigned to the current User. To assign Users to Parameter Lists, see Manage Data Sets, Manage Tests, and Manage Worksheets. |
| DataEntryByAssignTst | Opens Data Entry for all Samples assciated with the specified Parameter List. |
|
|
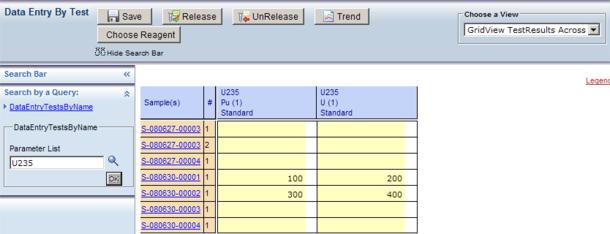
Data Entry By Test |
This opens Data Entry for all Samples associated with a specified Parameter List:
|
|
Editing Features |
|
|
| To... | Do this... | |||||||||
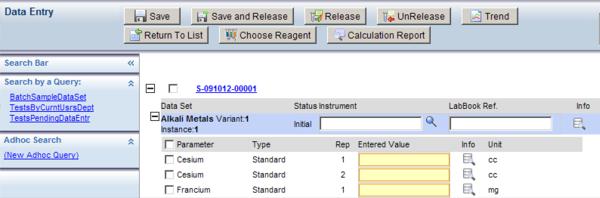
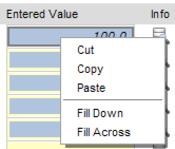
| Enter data values | Click a cell and type.
|
|||||||||
| Cut Copy Paste Fill Down Fill Across |
Right-click a cell and use the shortcut menu.
|
|||||||||
| View Data Info |
|
|||||||||
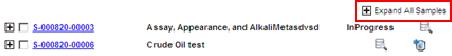
| Collapse All Expand All |
Operates on the selected Sample (or all Samples if none are selected).
In Single Sample List View, Collapse (or Expand) All DataSets collapses (or expands) all Data Sets. Each Data Set can also be expanded/collapsed individually by clicking the + or - icon.
In Multi Sample List View, Collapse (or Expand) All Samples... that's right, you guessed it... collapses (or expands) all Samples. The Sample header information remains visible.
|
|||||||||
| Add, Edit, View Sample Details |
|
|||||||||
| Assign Instruments |
|
Release and UnRelease |
|
|
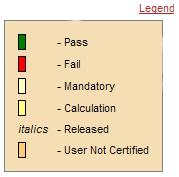
"Release" Releases the selected Data Items:
| • | "Release" implies that correct data have been entered for a Data Item. |
| • | After you "Release" all mandatory Data Items, the Data Set is ready for Approval. |
| • | Released data are not editable and displayed in italic font. |
| • | "UnRelease" (below) simply reverses the "Release" operation. |
Trend Charts |
|
|
Trend Charts display query-based plots of Sample data.
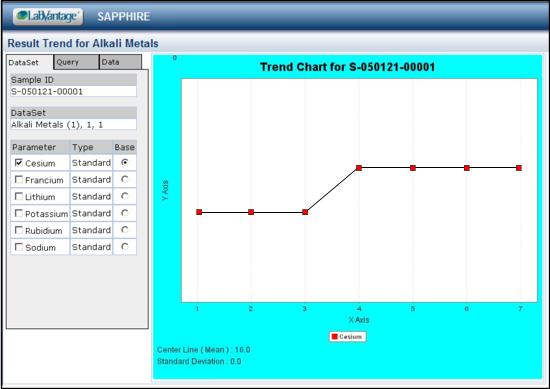
| • | To generate a Trend Chart, select at least one Data Item. |
| • | Under "Base", choose a Data Item that will be used as the centerline (mean) for the chart. |
| • | Under "Parameter", choose the Data Items to plot. |
| • | Control Limits are the positive (+) or negative (-) standard deviations (1/2/3) from the mean. |
| • | To view the query used and its details, click the "Query" tab. Here, you can also specify the number of rows to display under the "Data" tab. |
| • | The "Data" tab shows the set of Samples containing the Data Items used to generate the chart. |
Miscellaneous Data Entry Features |
|
|
Calculation Reports |
If faced with Calculation problems, a Calculation Report can be generated from a Data Entry page.
Selecting a calculated field in a Data Entry page, then clicking the Calculation Report button, generates a report similar to this:
|
|
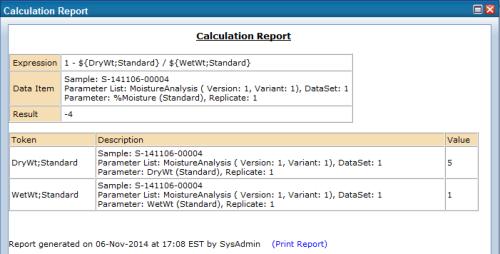
The report shows:
| • | The Calculation expression. |
| • | Details of the Data Item being calculated. |
| • | The calculation result. |
| • | Errors occurring at the expression level. |
For variable references, the report shows which Data Items were matched, and what their values were. It also shows variable-level errors (such as unmatched variables).
The Print Report link sends a "printer fiendly" report to the printer.
Calculation Reports drive from values stored in the database, not from unsaved values in the page. Therefore, ensure that the page has been saved before viewing the report.
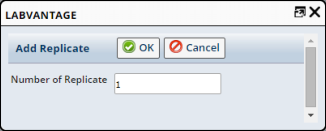
Add Replicate |
The "Add Replicate" Sidebar operation lets you easily add Replicates to selected Data Items.
After an Esig, this prompts you for the number of Replicates to add.
|
|
Data Item Display Rules |
In Classic Data Entry Pages, Data Sets that have been Cancelled, Retested, and made Unavailable are displayed during Data Entry. By contrast, note that in Enhanced Data Entry Pages, Data Sets that have been Cancelled, Retested, and made Unavailable are either not displayed during Data Entry, or displayed as read-only fields. In Enhanced Data Entry Pages, this functionality is controlled by the "Data Item Display" Rule property in the gwtdataentrygrid Element, which determines how data are displayed.